
Debug & Trace
PLS provides software debugging solutions and complete development tools for the 16/32-bit and 64-bit microcontroller families from various semiconductor manufacturers. A wide range of different MCUs are supported by the propriety UDE Universal Debug Engine® for debug, trace and test. PLS solutions are widely used by OEMs and Tier 1's for debugging embedded automotive and industrial applications.
The Universal Debug Engine® (UDE) from PLS is a powerful graphical user interface (GUI) for debugging, tracing, and testing embedded software across a wide range of microcontrollers and multicore SoCs. It offers a comprehensive feature set, including support for both high-level and assembler-level debugging, real-time observation, system visualization, and in-depth system analysis.
Designed with usability and efficiency in mind, UDE® offers advanced capabilities such as test automation, in-system flash programming, real-time operating system (RTOS) support, and AUTOSAR support features.
UDE®’s performance is enabled by the Universal Access Device family, which includes the UAD2pro, UAD2next, and UAD3+. These devices facilitate smooth and reliable communication with supported architectures and controllers. Their flexible adapter design allows for easy adaptation to a variety of debugging requirements and compatibility with multiple debug interfaces.
Engineered to streamline the development process, UDE® integrates seamlessly with modern software toolchains, helping to shorten project timelines and accelerate development cycles. Supported by the PLS development team’s deep expertise in controller architectures and on-chip debug features, UDE® delivers precise, reliable debugging and tracing tools tailored to the specific requirements of supported microcontrollers and embedded processors. This makes it a trusted choice for professional embedded software development.
UDE - Universal Debug Engine

UDE Features
Multicore Debugging Features
-
Enables core-specific loading of code and symbolic information, maintaining precise visibility for each processor core during debug sessions. This core-targeted approach ensures that developers can isolate and analyze behavior across heterogeneous cores without losing context.
The loader also supports the import of multiple ELF and HEX files, meeting the standard demands of today’s sophisticated multicore environments — whether you're managing inter-core interactions or running parallel workloads.
-
To maximize visibility in multicore environments, UDE applies distinctive color coding to each processor core. This visual separation is consistently maintained across the entire interface — from the Source code view to Variable and Memory views, and even within the multicore trace functionality. By visually distinguishing cores throughout all debug windows, developers gain immediate contextual awareness, simplifying parallel analysis and streamlining navigation in complex systems.
-
UDE supports parallel debugging of heterogeneous SoCs, Delivering comprehensive system-wide visibility and insight into cross-core interactions. This capability enables developers to efficiently track and analyze inter-core interference, regardless of processor type or architecture.
By facilitating synchronized debug sessions across mixed-core environments, UDE also enhances multicore profiling — helping teams fine-tune system behavior and performance with greater precision.
-
To optimize debugging of multicore applications, UDE offers the Run Control Group Manager, allowing developers to define synchronized core groupings. Cores with tight functional coupling, such as those coordinating critical tasks or sharing resources — can be configured to start, stop, and break simultaneously. Meanwhile, other cores continue executing independently in the background.
This flexible synchronization model enables targeted debugging in complex systems, and the entire setup can be intuitively customized through UDE’s graphical user interface.
Trace Features
-
UDE's trace functionality supports various interfaces, including on-chip trace buffers (such as ETB and MCDS) and external buffers integrated in PLS Universal Access Devices like the UAD2Next and UAD3+.
The MultiCore Trace View applies the same color-coding scheme used in the standard debug interface, enabling intuitive visual separation between cores. This view facilitates correlation of multi-core activity and visualizes data transfers in relation to their originating instructions.
Trace configuration is available either through an interactive dialog interface or via the PLS Universal Emulation Configurator (UEC), offering flexibility for diverse debugging workflows -
The Execution Sequence Chart in UDE delivers a clear, visual representation of your application's code execution, helping you trace transitions between tasks and functions with precise timing context. It enables intuitive navigation, allows searching for specific execution transitions, and provides insights into stack depth directly from the graphical interface.
For multicore devices, the chart offers synchronized visualization across cores along a unified timeline, making it easy to correlate inter-core interactions and execution flow
-
UDE offers both statistical and trace-based profiling to analyze your application's performance:
Statistical Profiling: Uses program counter polling with minimal runtime intrusion. Execution data is aggregated over time and mapped to individual functions, providing a statistical breakdown of runtime behavior.
Trace-Based Profiling: Offers the most accurate insight by capturing exact execution sequences over a defined time window. This method includes short-lived functions that may be overlooked by statistical profiling.
Profiling results are available in multiple formats—from high-level graphical summaries to detailed call graph analysis. Developers can examine inclusive and exclusive function timing to better understand performance bottlenecks and runtime flow
-
-
Standard Features
-
Enables optimized visibility of an embedded system, UDE allows activation of real time updates for variables. Variables are then automatically updated and be logged into a file with a resolution of up to 25ms.
-
Enables a more graphical view of variables adding different variables into a graph to better outline the relationship between signals and their overall timing. These variables can be updated with a resolution of up to 1ms.
-
Simple Access to standard run control functions like Go, Halt, Single Step, Step Into, Step Outof, Setting Breakpoints on code lines or variables that are essential to daily work. These functions can be accessed through selective mouse clicks, sub menus, and Hot Keys.
-
Navigating complex code can be challenging. The UDE call stack view supports efficient code navigation by providing clear visibility into nested calls and potential sources of delays. Focused access to each function's local variables further enhances the debugging experience.
-
UDE offers an in-depth view into all peripheral registers across modern microcontrollers. With the increasing number of integrated peripherals, UDE goes a step further by providing contextual descriptions and explanations for each register bit and bit field, helping users interpret complex configurations with ease.
Access to protected registers can be selectively unlocked, allowing for seamless modifications during debug sessions. Additionally, UDE’s integrated real-time update capability enhances runtime analysis, ensuring developers can monitor system behavior live with minimal disruption.
-
RTOS Support in UDE enhances embedded development by optionally integrating with numerous Real-Time Operating Systems. It offers RTOS-aware interface that reveals task status, queues, semaphores, task timers and Task - bringing clarity to complex runtime environments.
Whether you’re working with SafeRTOS, FreeRTOS, PXROS-HR, µC/OS, AUTOSAR OS via ORTI/ARTI, or other platforms, UDE adapts to give you powerful insights. Feature availability may vary depending on the operating system, so we encourage reaching out for tailored compatibility details. -
Flash Programming
PLS supports flash programming for various devices including both on-chip and external flash devices that are suitable during the development process and throughout integration test as well as scaled production programming.
Flash Programming Support
PLS enables flash programming for a wide range of devices, including both on-chip and external flash, across the entire development lifecycle—from early integration testing to full-scale production.
Manual Programming
PLS offers interactive manual programming with granular control over sector selection and configuration memory setup (e.g., HSM/HSE Setup OTPs). Users benefit from a detailed bit-level configuration dialog that includes Cross-check verification and Auto checksum calculation
UDE also supports security configuration to protect memory from unauthorized access or modification, helping safeguard devices against hacking attempts.
Production Programming
PLS also offers Gang Programming solutions designed for high-volume, simultaneous programming of multiple devices. These solutions integrate easily into third-party production environments—such as end-of-line testing setups—using a broad selection of scripting languages including VB, Python, C#, PERL, HTML, and others. This enables flexible automation and efficient deployment tailored for scalable manufacturing workflows
Supported Architectures
PLS supports a wide range of microcontrollers and multicore SOC’s. Ranging from simple single-core devices to multi-core SOC’s with heterogeneous design and specific extensions such as protection cores (hardware security modules) and tracing capabilities.
-
Cortex-A53 S32G
Cortex-R52 S32Z, S32E
Cortex-M7 S32K3
Cortex-M4, Cortex-M7 S32M
Cortex-R52 S32S
Cortex-A53 S32V234
Cortex-M7 i.MX RT
Cortex-M33 KW45
Power Architecture MPC56xx, MPC57xx, S32R
-
Aurix TC4xx
Aurix TC3xx
Aurix TC2xx
TriCore AUDO TC1xxx
TRAVEO™ T2G Arm® Cortex®
PSoC4™ Arm® Cortex®
MOTIX™ MCU embedded power ICs
XMC7000 Arm® Cortex®-M7
XC2000, XE166
-
Cortex-A53 TI Sitara AM64x
Cortex-R5F TI Sitara AM243x, AM263Px
Cortex-A72 TI Jacinto 7 TDA4, DRA8
Cortex-M0+ MSPM0
Cortex-R4 TMS570
-
SiFive FE310
E20
E24
-
RH850 G3K, G3M, G4M
Cortex-M33 RA4, RA6
SuperH SH-2A
-
Cortex-R52, Cortex-M7 Stellar
Cortex-M33 STM32H5, STM32L5, STM32U5
Power Architecture® SPC56x, SPC57x, SPC58x
-
Arm7/9
Arm11
Cortex-A
Cortex-AV8
Cortex-M
Cortex-R
Cortex-RV8
-
ARC RM Family EM4, EM5, EM6, EM7, EM9, EM11, EM22
ARC EV Family EV7x
ARC HS Family HS3x, HS4x
Virtual Development Kit (various cores)
Universal Access Devices UAD
UDE®’s performance is enabled by the Universal Access Device family, which includes the UAD2pro, UAD2next, and UAD3+. These devices facilitate smooth and reliable communication with supported architectures and controllers.
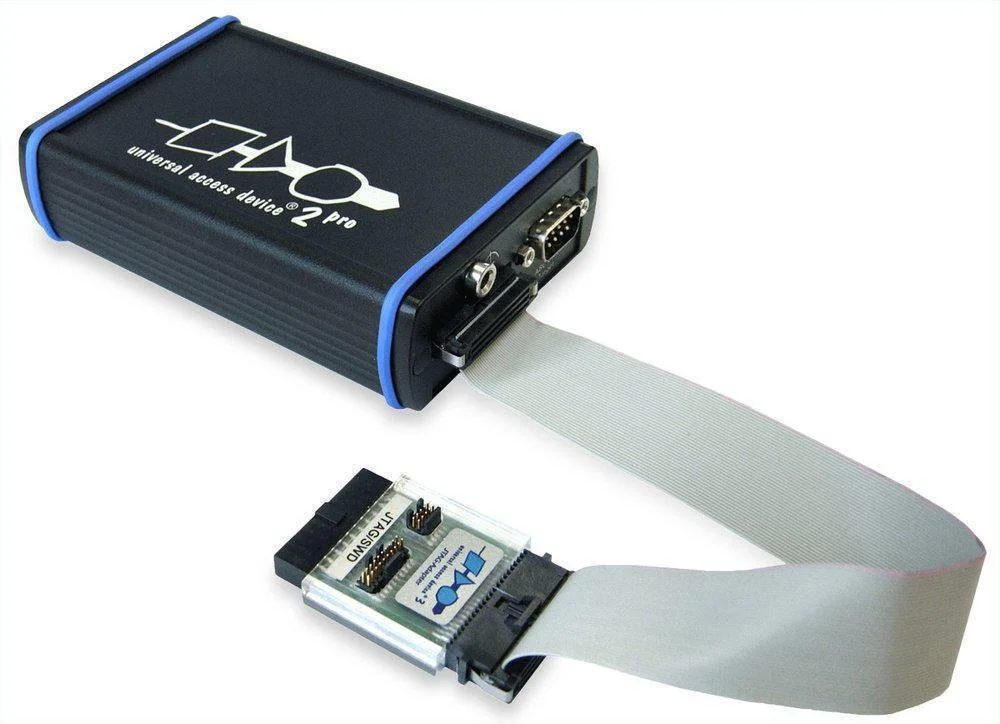
UAD2pro
The Universal Access Device 2pro is the new smart member of the UDE® target Access Device family. It replaces the approved UAD2 and offers new enhancements in the well-known form style. It establishes a bridge to the more powerful UAD3+ using the same target adapter solution.
UAD2next
The Universal Access Device2next is the powerful successor of UAD2+ and is the new all-in-one device in PLS’s UDE® target access device family. It combines the state-of-the-art debugging features of the UAD2pro with trace capabilities, which makes it ideal for efficient debugging, test and system-level analysis.

UAD3+
The Universal Access Device3+, a further development of the already established UAD2 family, was particularly optimized for use in multicore and multi-target systems with high clock frequencies. Thanks to the flexible pod and connector designs, up to eight various cores and targets respectively can be controlled with different debug protocols. A consistent further development of the JTAG extender technology by PLS permits connection lengths of up to 5 meters to the base unit. The extenders are optionally available with galvanic electrical isolation. Furthermore, with the flexible design, the pods can also carry out tasks such as CAN interface or logic analyzer probe.

UAD Models Side-by-Side
In addition to standard debugger features like high-level language stepping, call stack, and watch windows, PLS offers intuitive capabilities such as real-time visibility and performance metrics—even on standard devices—designed to enhance every engineer’s efficiency. For selected devices, PLS also provides optional real-time trace, profiling, and code coverage solutions.

Interfaces
The flexible adapter design allows for easy adaptation to a variety of debugging requirements and compatibility with multiple debug interfaces including but not limited to, JTAG, cJTAG, SWD, DAP, Nexus.